
Turo concluded 2023 with $2.41 billion in gross bookings, $879 million in revenue, and a net profit of $14.7 million. Not too bad if you want to go public, which Turo does want, sometime in the foreseeable future. This #movingpeople deep-dive explores Turo’s 2023 IPO prospectus and the ups and downs of its financials.

Turo is the global leader and category builder in P2P car-sharing, founded in 2010. Today the company has:
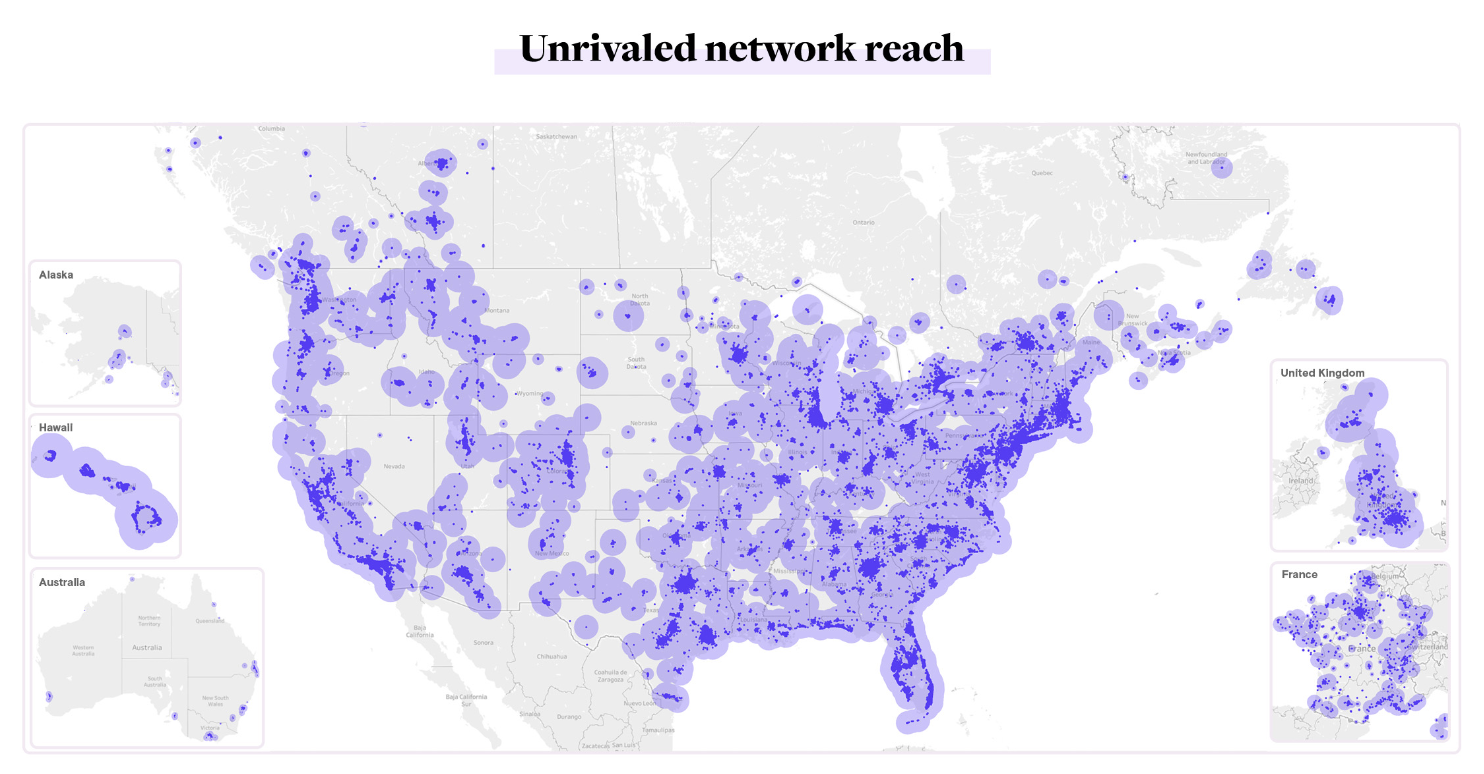
Presence in the US, UK, Canada, Australia and France, in >14,000 cities
170,000 active hosts, 360,000 active vehicles(1), and >1,500 car makes and models
24.4 million days booked in 2023 by 3.7 million guests
2021 was a pivotal year for Turo. The company exploded in bookings and revenue, growing from $352M gross bookings & $149M revenue in 2020 - to gross bookings of $1.25 billion & $469M revenue in 2021.
Growth was fuelled by post-pandemic increased usage, compounded by the rental car supply shortage, which also led to higher vehicle rental prices. In short, more demand, less competition, higher prices. Perfect.
Growth continued in 2022 and 2023, driven by continued increased demand, together with automotive supply chain shortages affecting traditional rental companies. With time, rental car supply shortage began to ease and competition intensified, leading to decreasing price per day, and to lower growth rates.
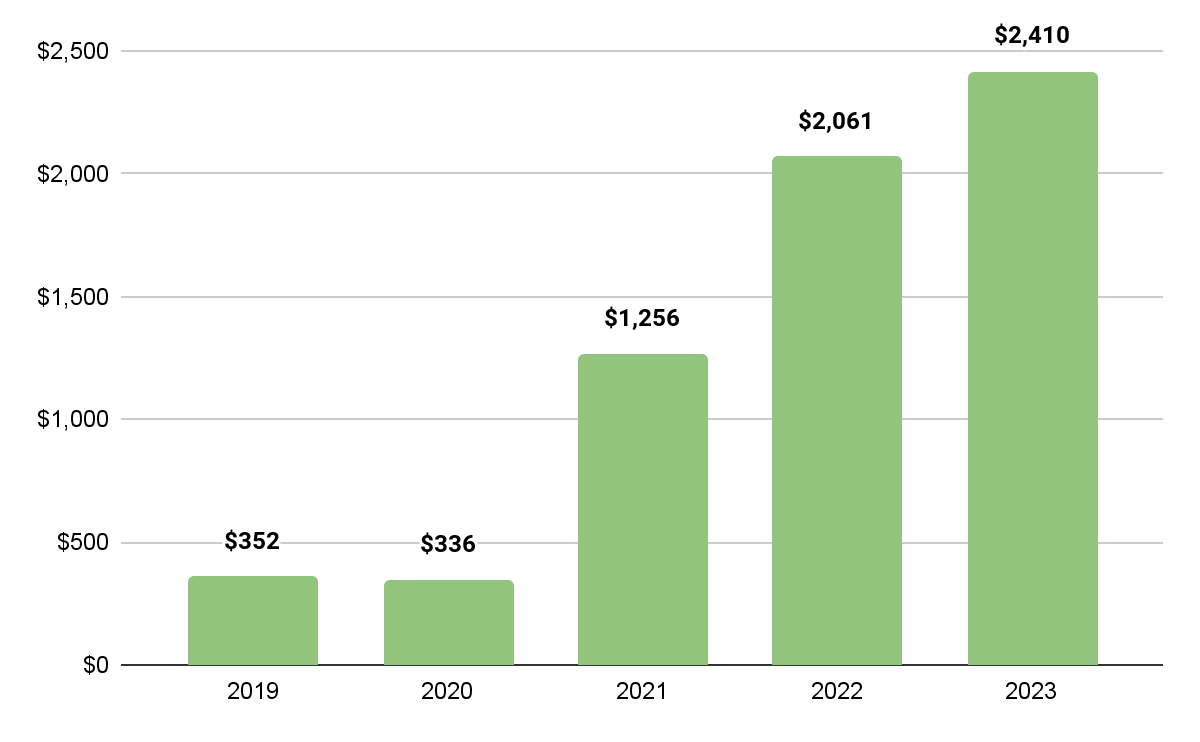
Gross Booking Value (GBV), $ millions, 2019-2023
In 2019-2020 Turo saw circa $330-$350 million in gross bookings; by 2023, that number grew to $2.41 billion.
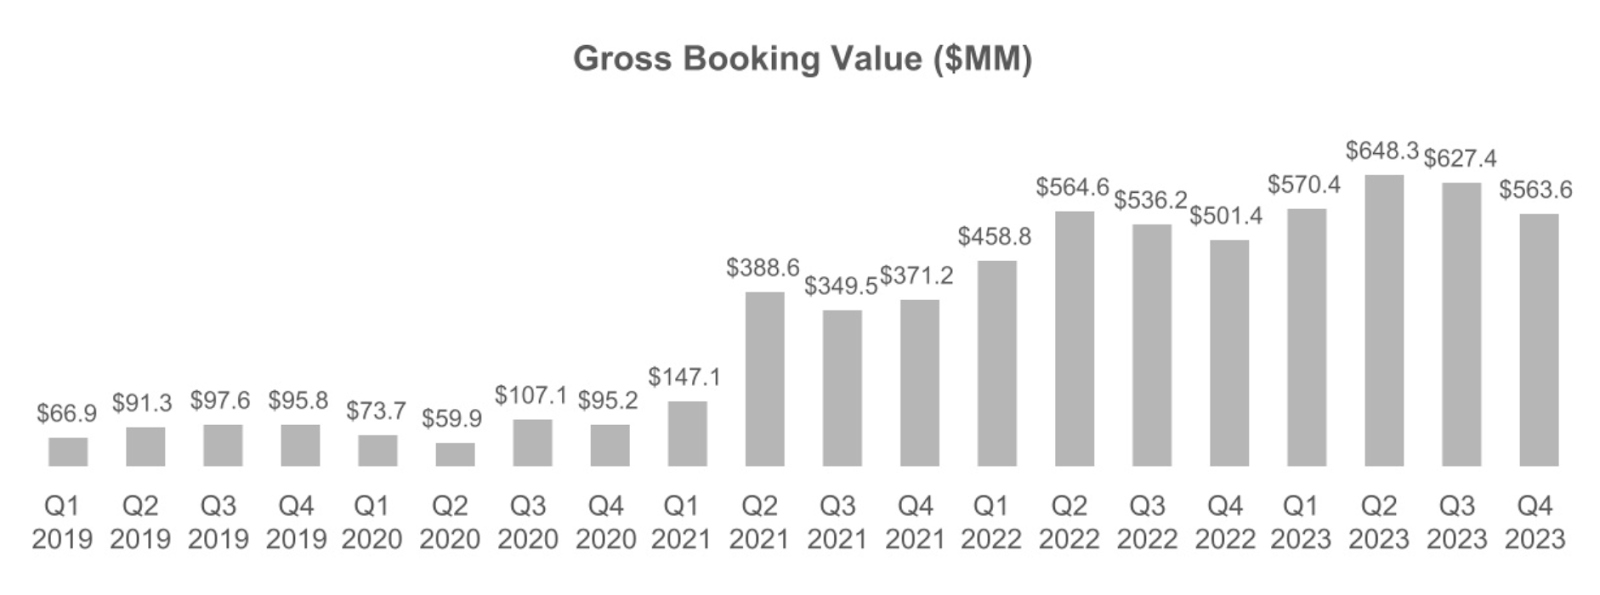
The “magic” moment can be seen here, in Q2/21. Turo has not looked back since.
Turo prospectus
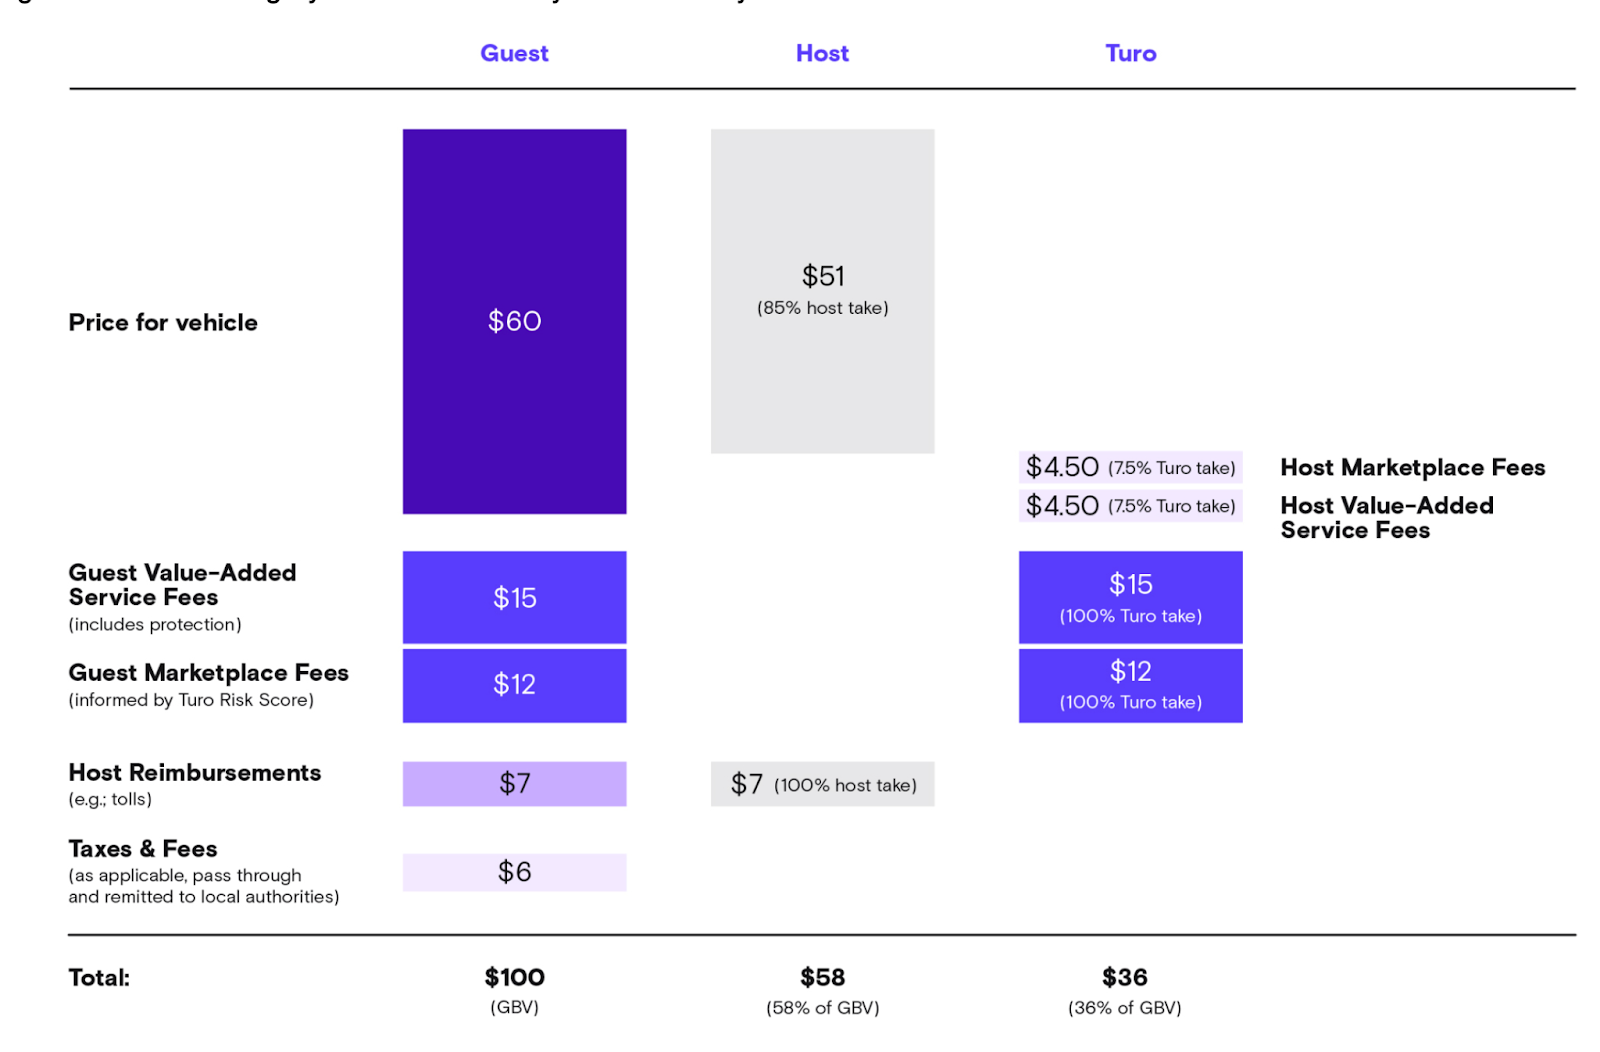
The chart below, by Turo, explains the company’s business model and pricing breakdown. A roughly 2/3-1/3 split with hosts, with Turo taking as revenue an average of +36% of gross bookings.
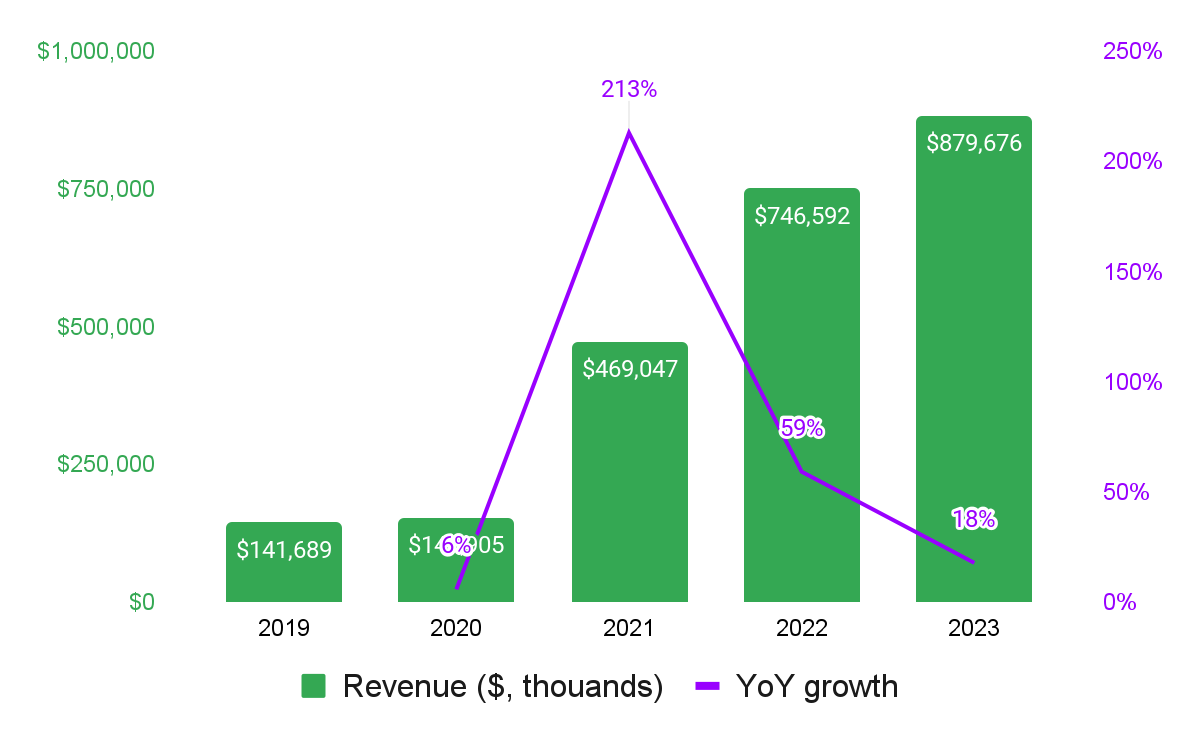
Naturally, revenue grew with gross bookings.
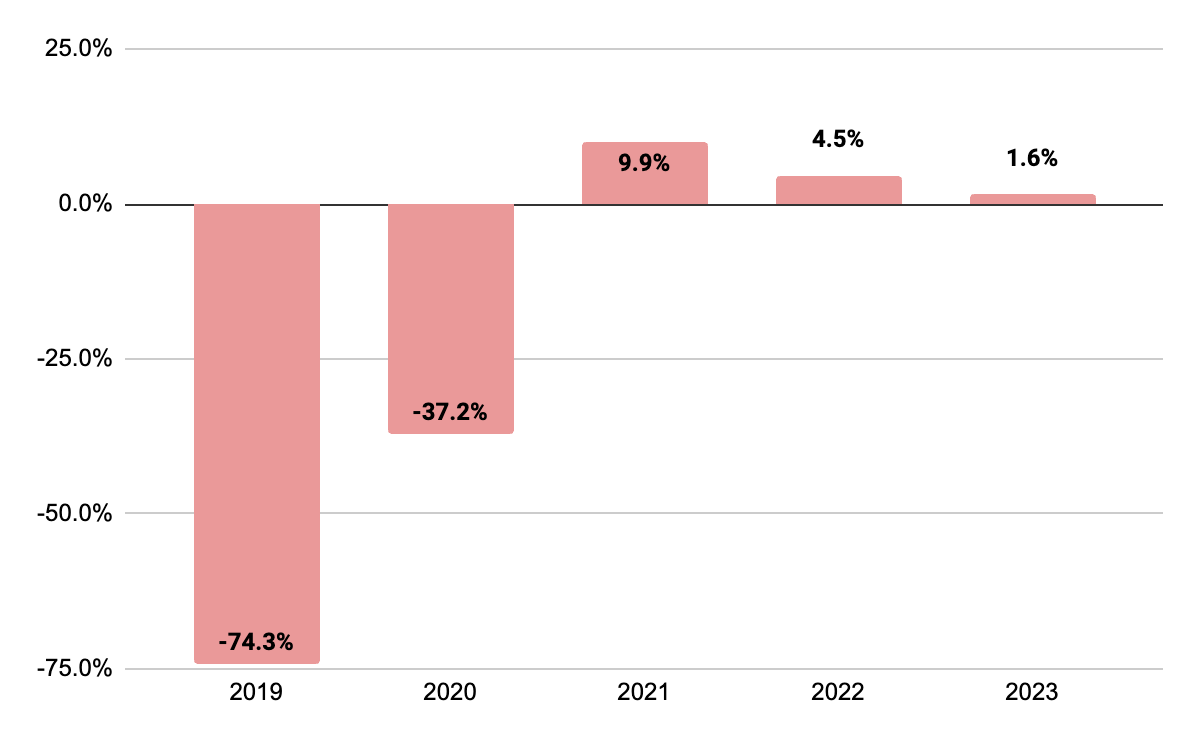
Revenue ($, thousands) and YoY growth (%), 2019-2023
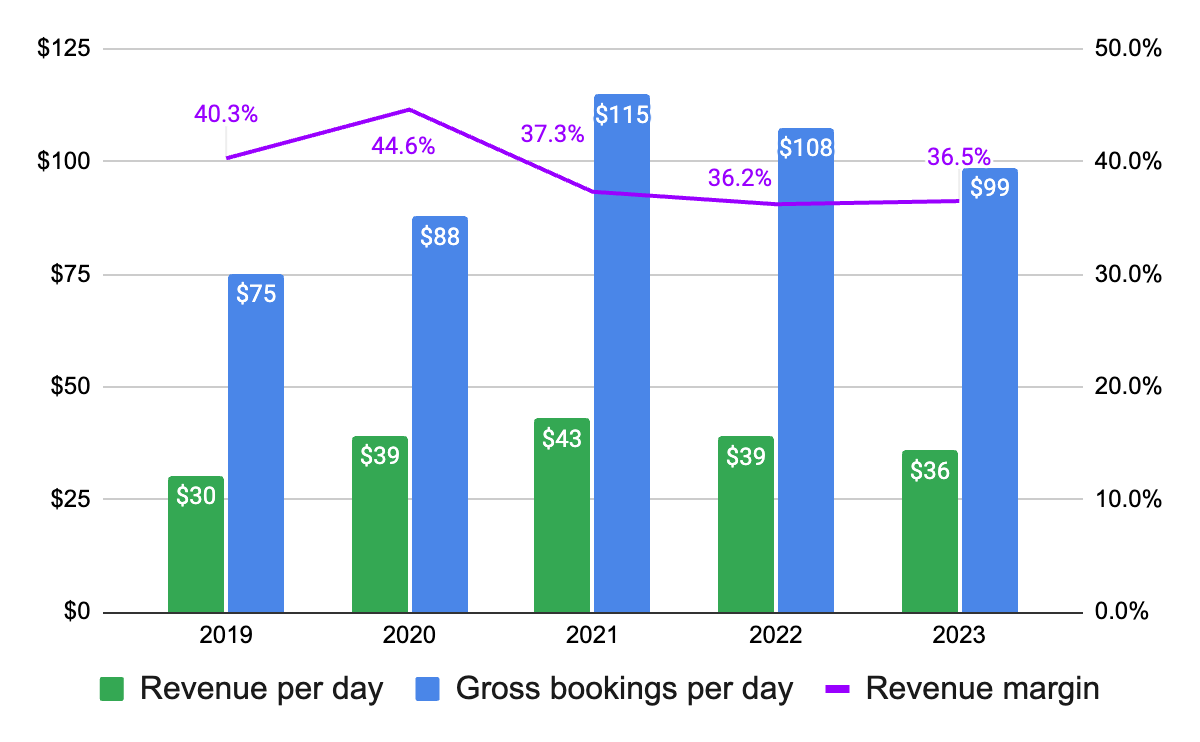
The chart below shows how the ease of automotive supply chains and the “return” of traditional rental companies contributed to the lower booking and revenue per day from the high of 2021.
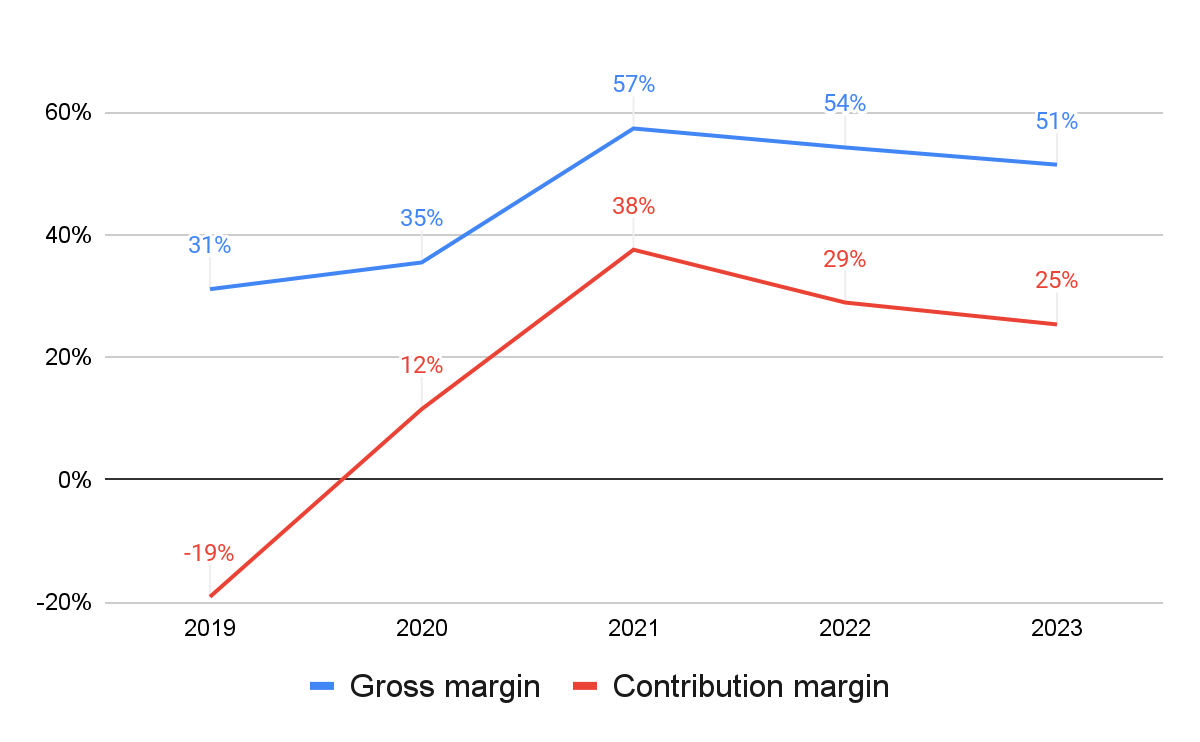
After taking the ±36% of the GMV, Turo has additional gross expenses(2), leading to gross margin of over 50% in 2021-2023 and contribution margin(3), a more operational metric, of 25% in 2023.
Gross and Contribution margin, %, 2019-2023
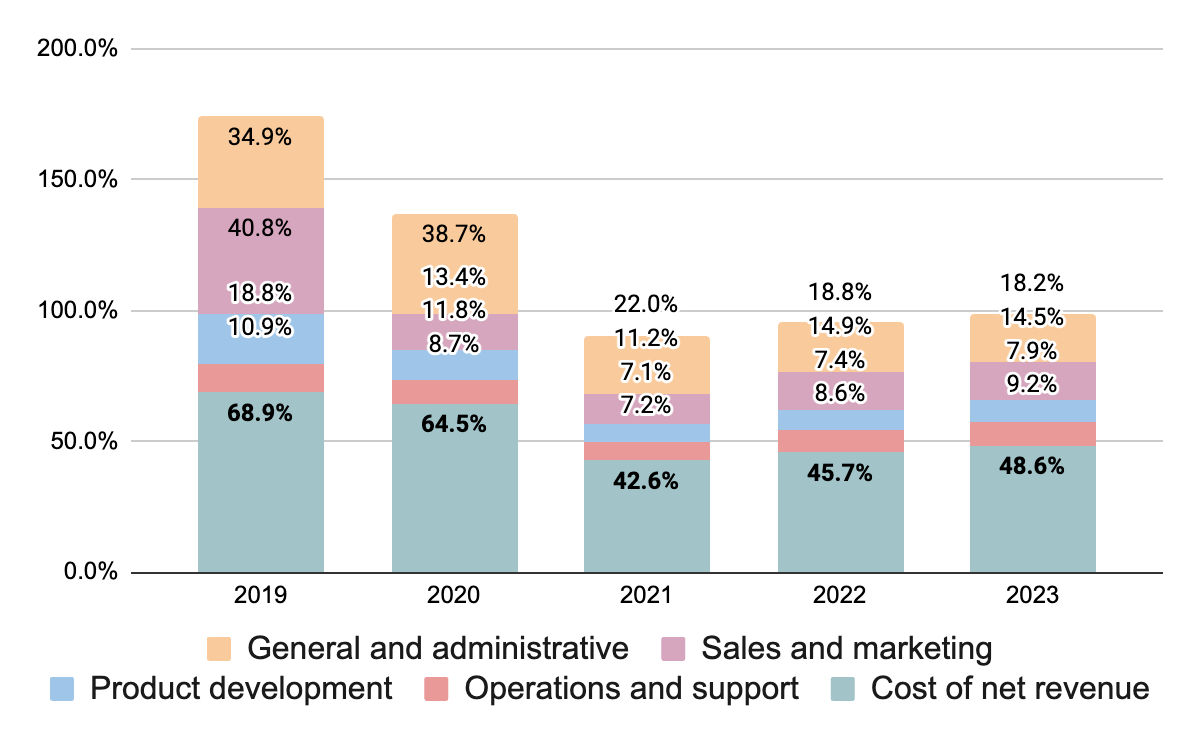
The company first achieved operational profitability in 2021; we can see that cost of net revenue is reduced, from circa %65 in 2019-2020 to circa 45% in 2021-2023. This is thanks to increased usage, increasing price per day and operational efficiency (e.g. “Turo Risk Score”).
Expenses breakdown, out of gross profit, %, 2019-2023:
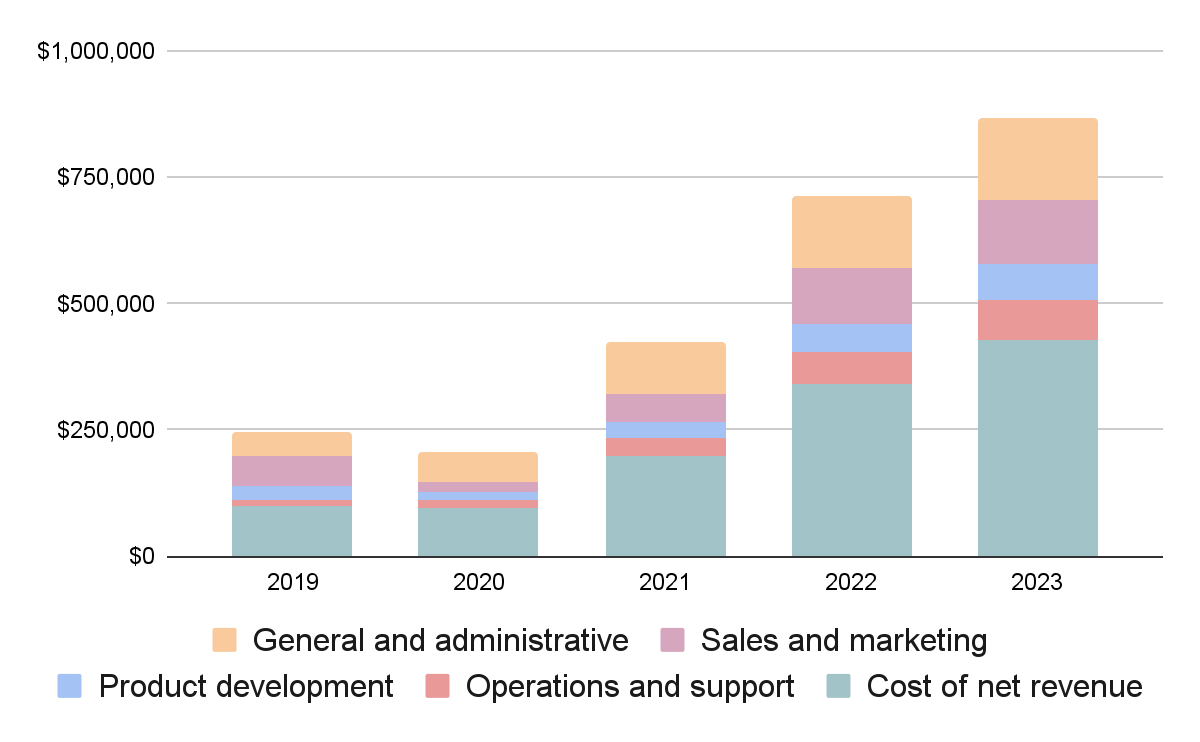
We can easily see the growth in expenses in $ terms between 2019-2020 and 2021-2023. Comparing with the chart above, we see that expenses grew from both in $ terms and as a % of gross revenue, excluding G&A which has been reduced as a % over the years.
Expenses breakdown, $ million, 2019-2023:
Operational profitability reached peak in 2021; and at 2023 is thin, at %1.6.
Income (loss) from operations, %, 2019-2023:
Which bring us to the final P&L chart: Revenue, Gross Profit, (Loss) income from operations and Net (loss) income, $ thousands, 2019-2023
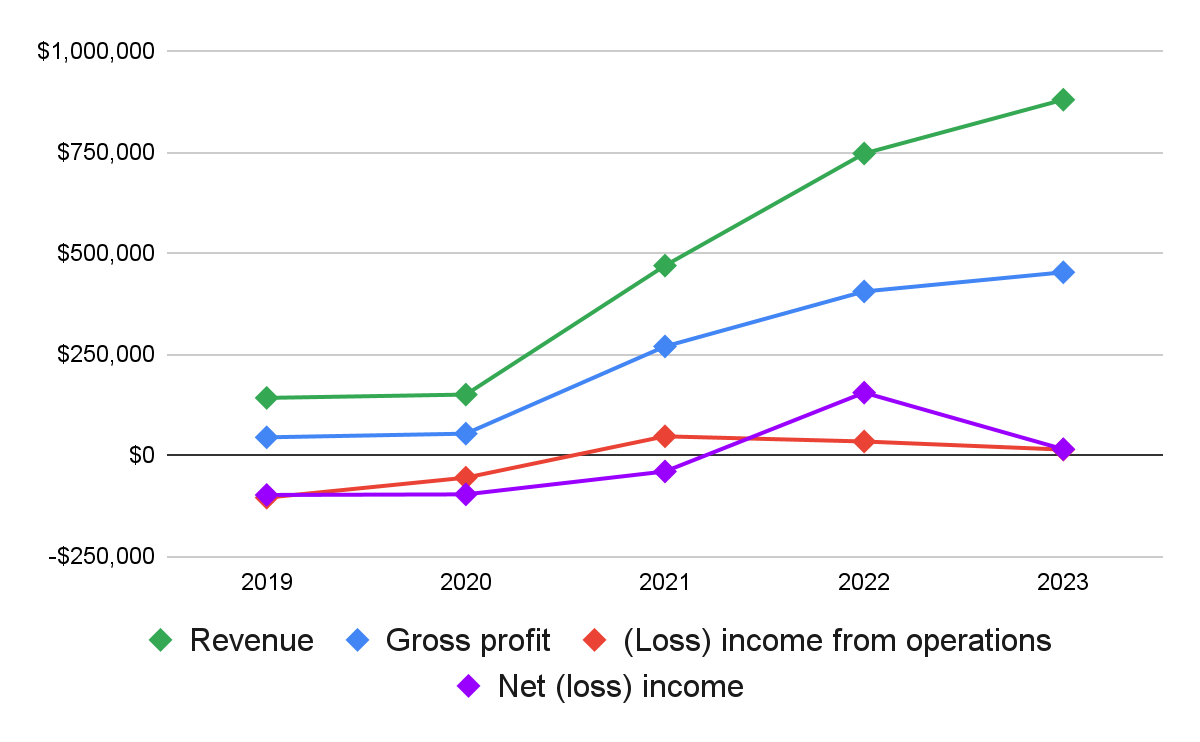
Note that in 2021-2022 net loss/income is varied from loss/income from operations; this has to do with stock revaluation and provision for income tax. Since this is not an operational expense, we’ll move on.
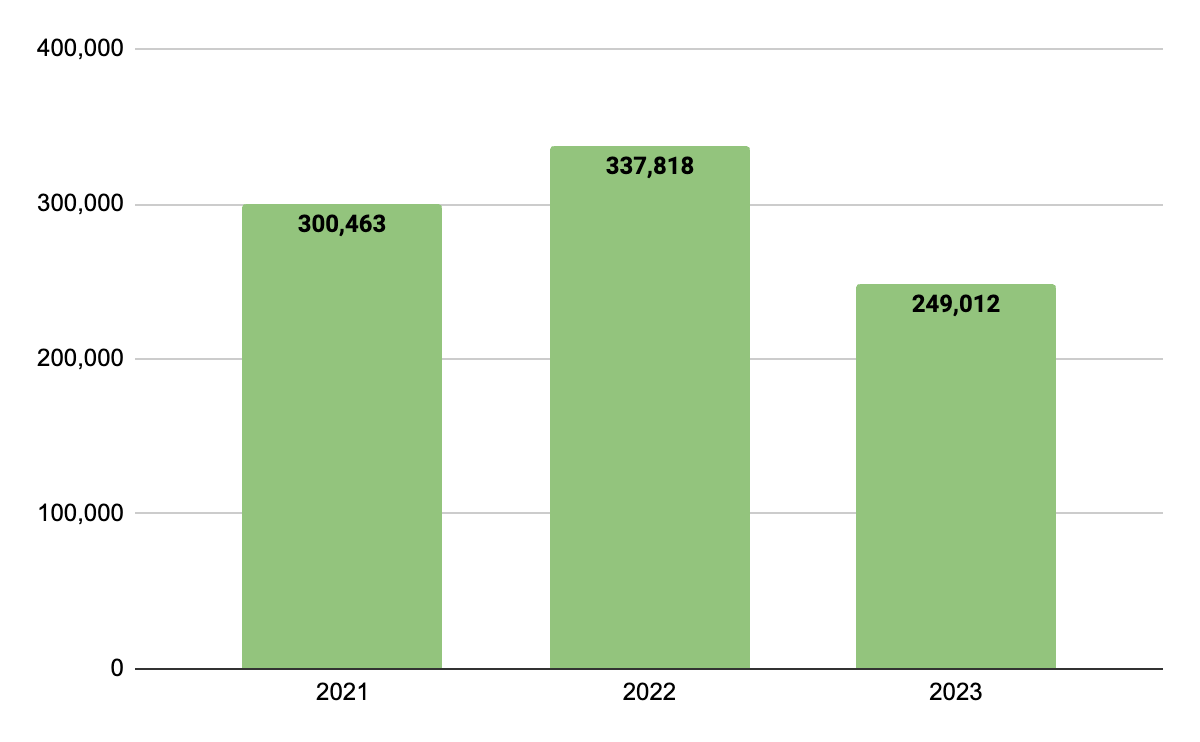
And lastly in terms of financial analysis, Cash Flow, $ thousands, 2021-2023. 2022 saw the company increase its cash flow levels, not so in 2023. Refer to the cash flow statement on page F-8 for more.
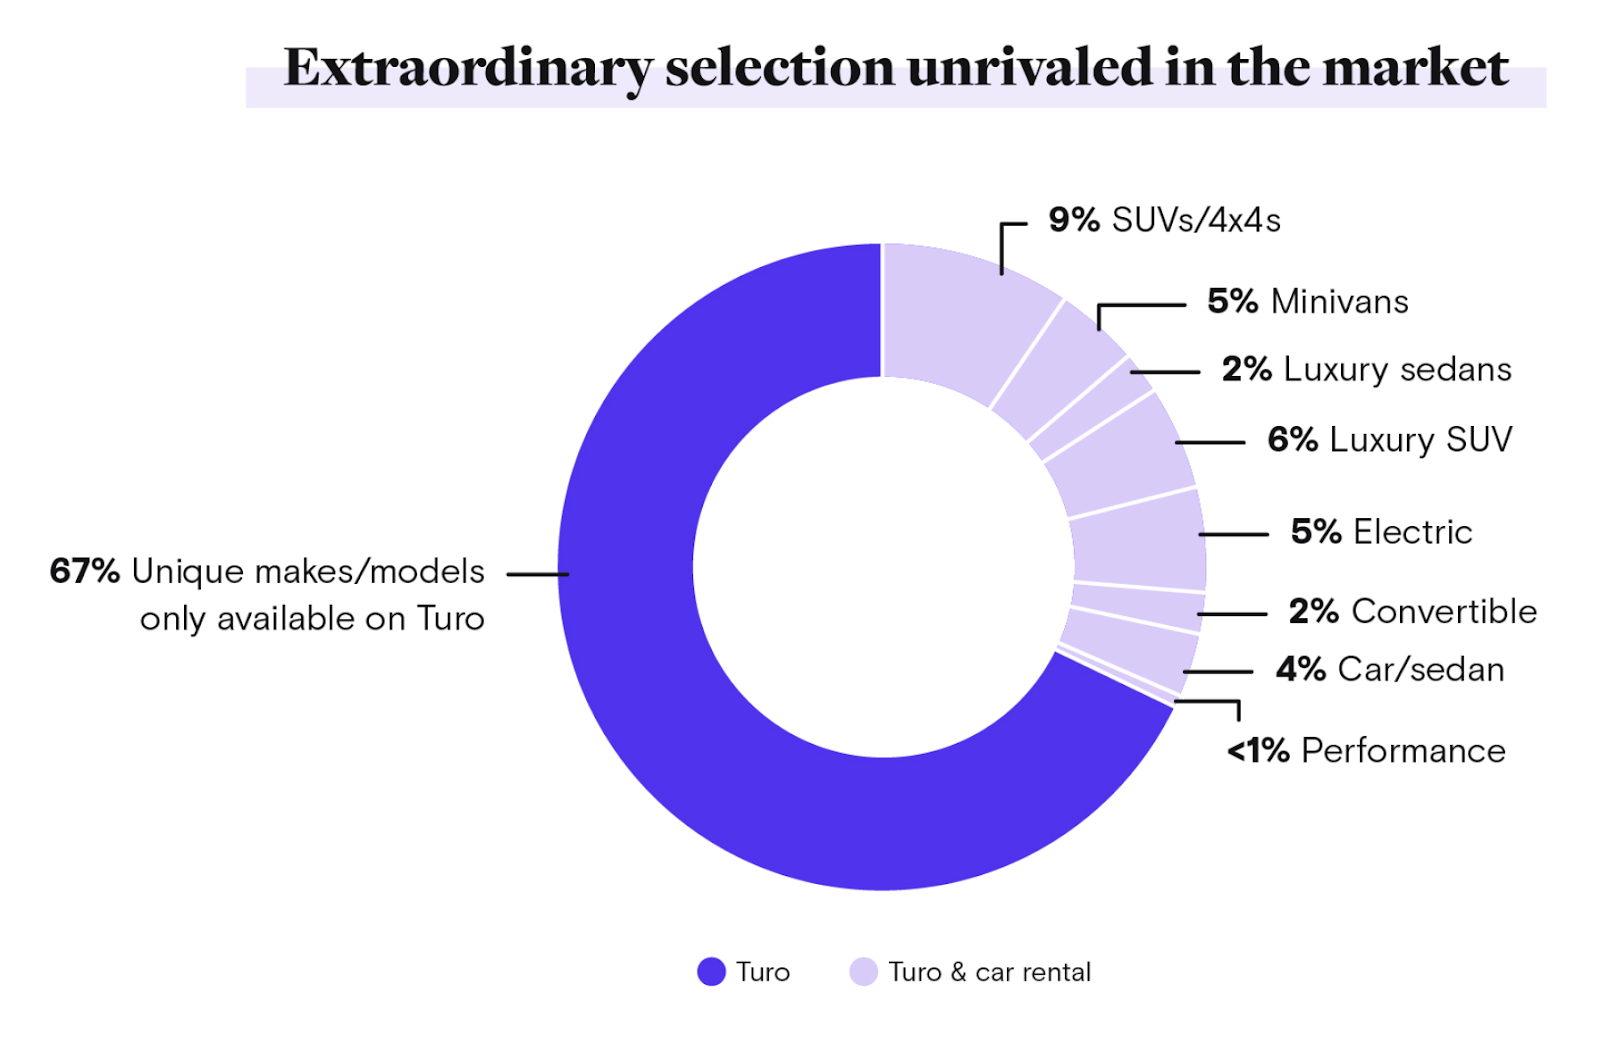
Turo’s competitive advantage is build out of the following elements:
Unique inventory - Turo has over 1,500 makes and models, far more than any rental company.
Interesting data point: 18% of GBV came from trips taken with premium and exotic cars.
Marketplace density - allowing guests to book virtually anywhere.
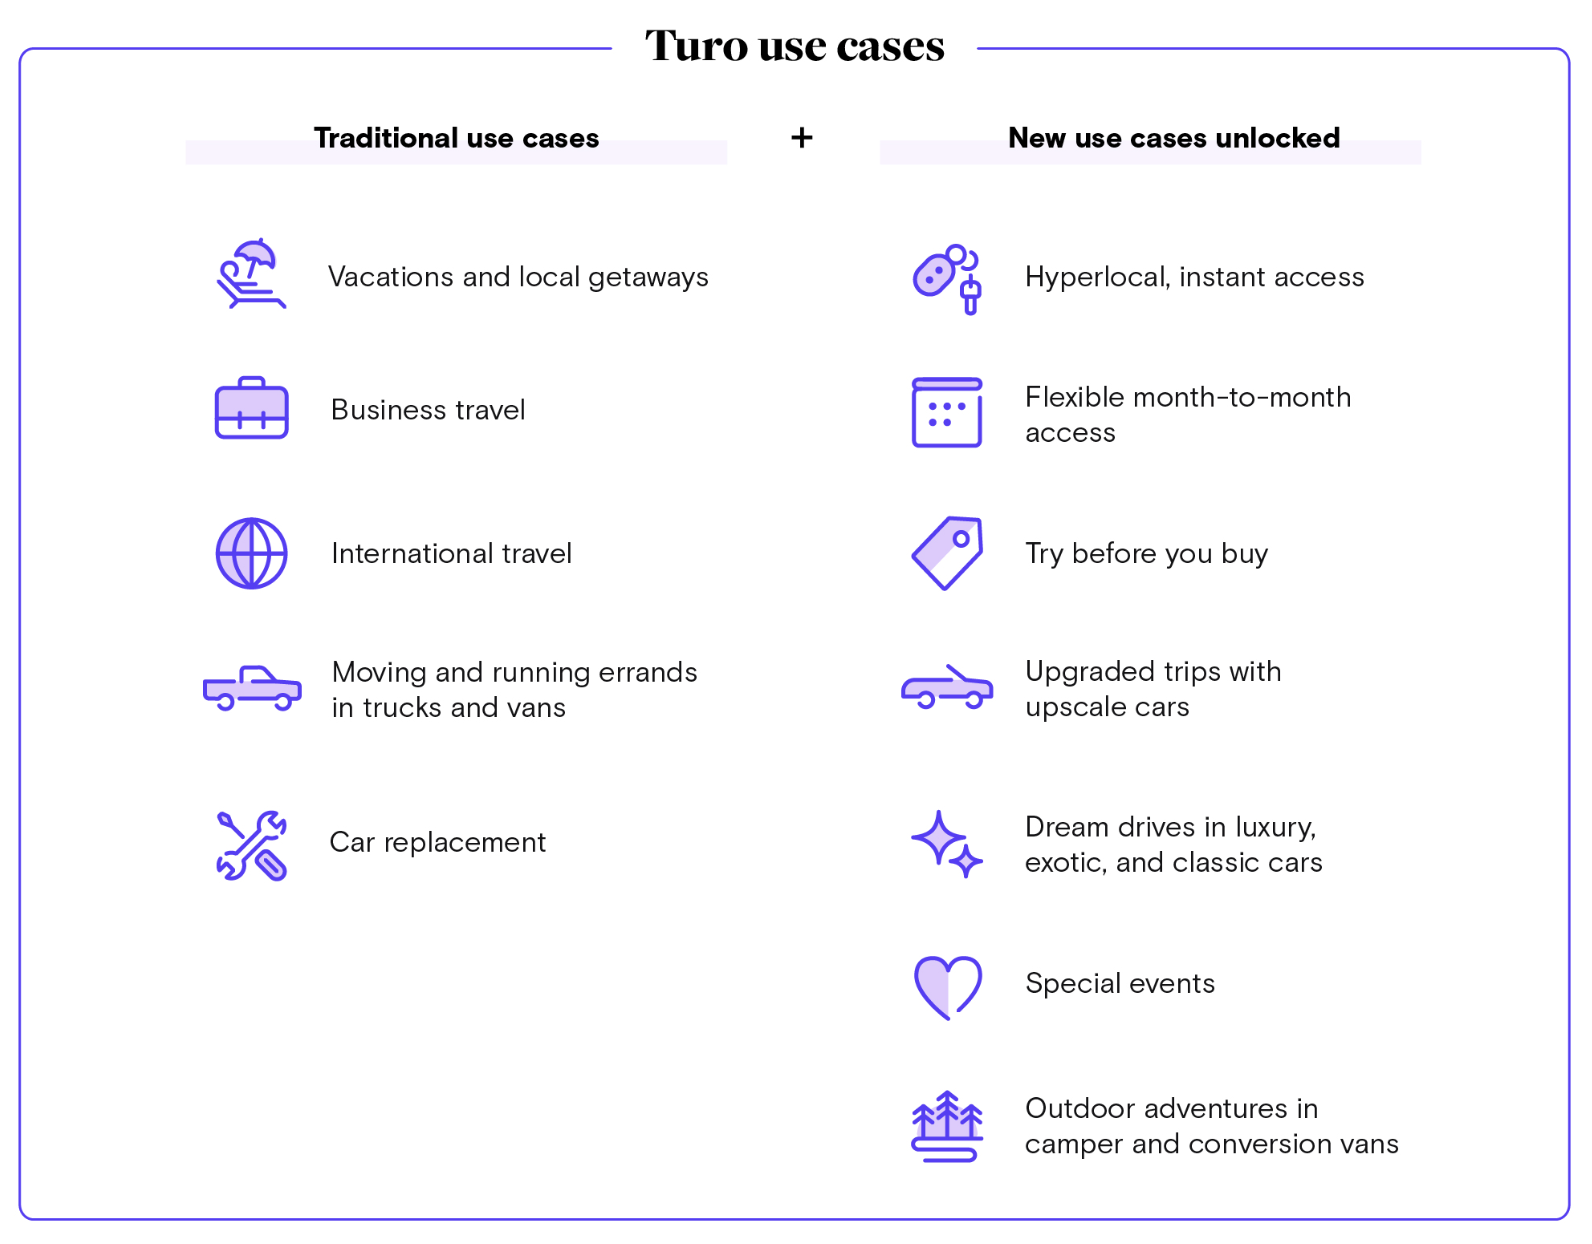
More use case scenarios
And also:
Robust app and customer experience - In 2023, approximately 57% of Days were generated from bookings by repeat guests.
Data generated by years and millions of miles of operations, for example resulting in “Turo Risk Score” implementation, leading to improved operational efficiency
Brand awareness and trust
Value - price vs. traditional large rentals
As for future growth, this is where it gets a bit more complicated. In the prospectus, Turo mentions new vehicle categories (3-wheeler for example), international market expansion and M&A across the value chain. We’ll have to wait and see what comes first - a meaningful commercial move or an IPO.
To conclude, Turo had an amazing run since 2021, with gross booking and revenue growing double (or triple) digits YoY for 3 consecutive years; the company is comfortably profitable and its competitive advantage is solid. The downsides are (1) a thin operational margin - 1.6% in 2023; and to add on that (2) questions of Turo’s ability to continue similar growth in the next years.
In a better market, Turo would have gone public by now. Unless something very wrong is happening right now, We should expect to see the company go public either later this year, or in 2025.
Definitions
(1) We count active hosts as hosts with at least one trip as a host in the trailing 12-month period, and the number of active vehicle listings as vehicle listings with at least one trip in the trailing 12-month period.
(2) Cost of net revenue primarily consists of costs associated with the Company’s host and guest protection programs and platform costs. Protection program costs include costs of physical damage to host vehicles, offset by amounts subrogated from third-parties, liability insurance premiums, loss reserves, claims processing, and personnel related expenses. Platform costs include payment processing fees, costs associated with third-party data centers used to host the Company’s platform, and amortization of internally developed and acquired developed technology.
(3) We define contribution profit (loss) as our gross profit less our (a) operations and support (excluding stock-based compensation expense), (b) sales and marketing expense attributable to customer acquisition, including media spend, sales, headcount costs (excluding stock-based compensation expense), and marketing promotions, and (c) chargebacks, bad debt expense, and trust and safety verifications included in general and administrative expense, plus (i) stock-based compensation expense included in cost of net revenue, and (ii) amortization of internal-use software included in cost of net revenue.